Quite often, domain users complain about slow computer startup and login time caused by long processing of Group Policies (GPO). From the user’s point of view, the computer boots for a long time and it seems it hangs up for several minutes on the stage of “Applying computer/user settings“. In this article I will try to collect useful diagnostic tools and methods that allow an administrator to determine the reasons of slow GPO applying on the domain computers.
Actually, there are a number of reasons why Group Policies take a long time to be applied: these can be DNS issues, DC availability and the speed of connection to it, wrong configuration of AD sites or replication problems, misconfigured group policies, incorrect scripts, etc. It’s hard to describe an all-in-one algorithm to diagnose all these issues. When solving such problems, as a rule, an important role is played by the experience and skills of a administator who makes diagnostics. In this article, we will focus only on the diagnostics of the problems with the GPO and GPClient mechanisms.
How to Block Group Policy Inheritance
To make sure that the issue is related to the domain GPO, create a separate OU in the domain and move the problem computer to it. Then using Group Policy Management Console (GPMC.msc) enable blocking of policy inheritance for this container (Block Inheritance). Thus, all domain policies will stop to be applied to this container (policies with the Enforced mode enabled are the exception).
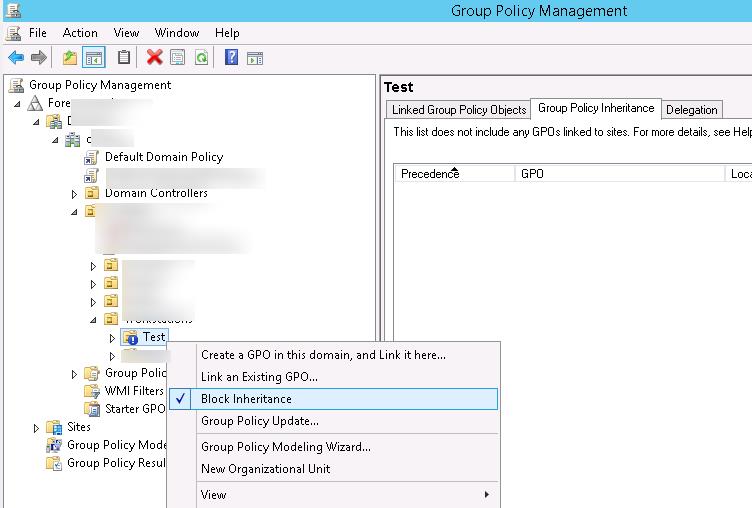
Restart the computer and check if the problem with slow GPO applying persists. If it persists, it is likely that the problem is in the computer itself or the local group policies (try to reset them to default ones).
How to Display Detailed Information on the Boot Screen
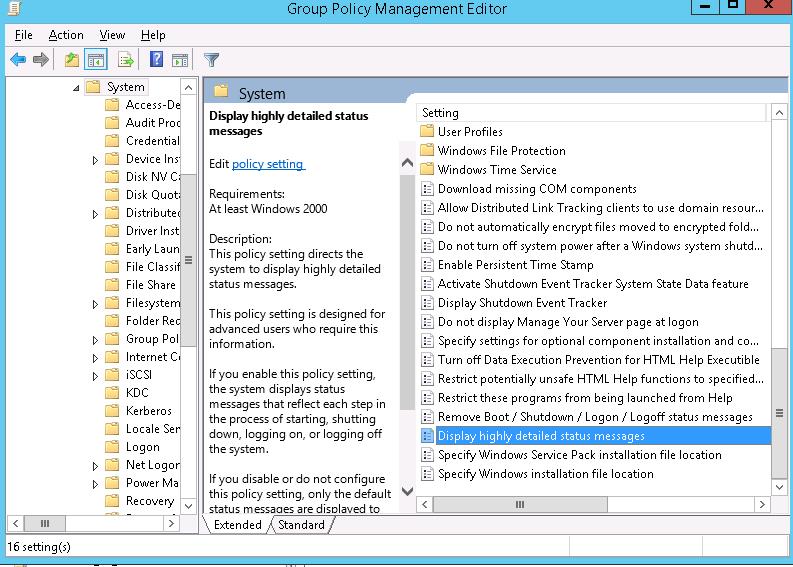
In Windows, you can enable the display of detailed status information that allows users and the administrator to visually understand at what stage of computer loading the greatest delay is observed. If you enable this policy, the information about GPO components being applied is also displayed.
You can enable this policy in the following GPO section:
- in Windows 7 / Vista : Computer Configuration -> Policies -> System -> Verbose vs normal status messages = Enabled
- in Windows 8/10 : Computer Configuration -> Policies -> System -> Display highly detailed status messages = Enabled
The same parameter can be activated via the registry. To do it, create a DWORD parameter with the name verbosestatus and the value 1 in the registry key HKEY_LOCAL_MACHINE\SOFTWARE Microsoft \Windows \CurrentVersion\Policies\System.
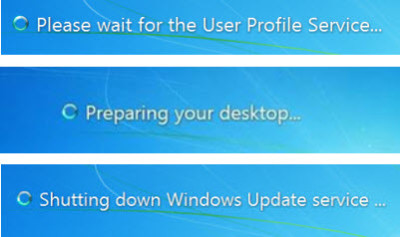
As a result, during boot you will see the following messages on the screen:
GPResult Report
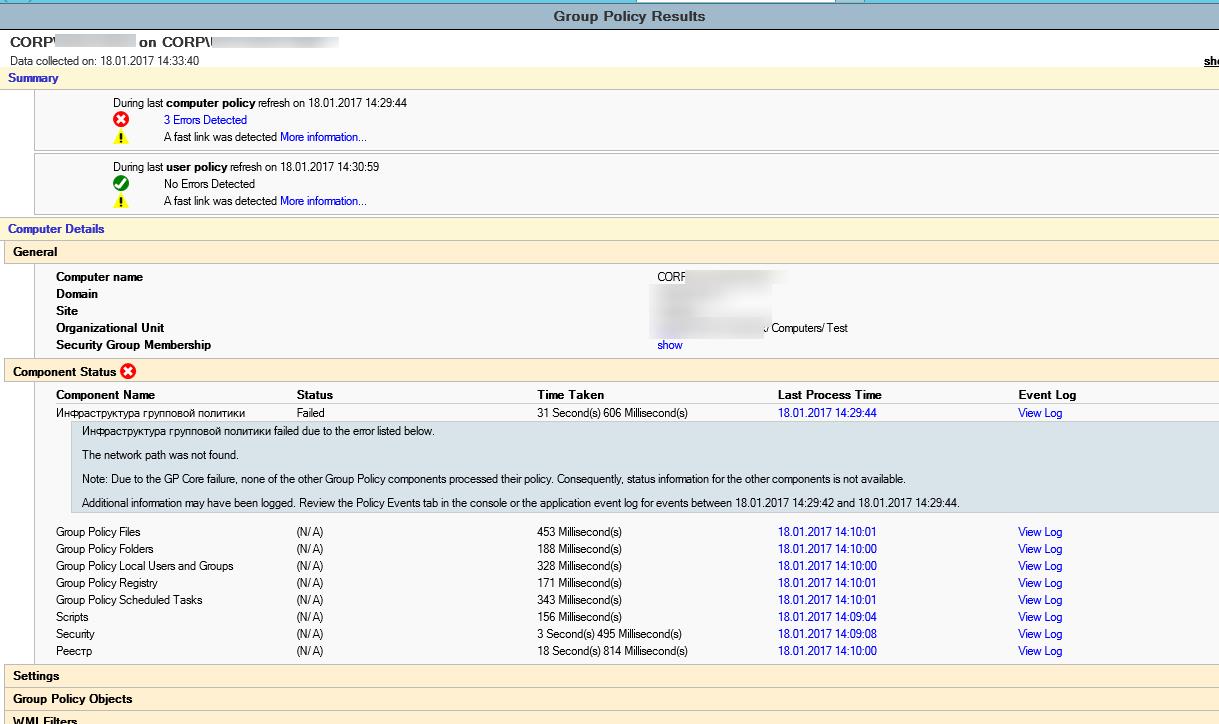
It’s better to analyze the resulting policy applied to the computer using the GPResult HTML report that can be created with the following command run with the administrator privileges:
gpresult /h c:\scripts\gpreport.html
This report is quite convenient for the analysis and contain references to errors when applying GPO.
Also, in Computer Details -> Component Status section of the report there are useful data of the application time (in ms) of different GPO components that look like this:
Group Policy Files (N/A) 432 Millisecond(s) 19.02.2017 11:10:01 View Log
 Group Policy Folders (N/A) 188 Millisecond(s) 19.02.2017 11:10:00 View Log
 Group Policy Local Users and Groups (N/A) 338 Millisecond(s) 19.02.2017 11:10:00 View Log
 Group Policy Registry (N/A) 171 Millisecond(s) 19.02.2017 11:10:01 View Log
 Group Policy Scheduled Tasks (N/A) 353 Millisecond(s) 19.02.2017 11:10:01 View Log
 Scripts (N/A) 156 Millisecond(s) 19.02.2017 11:09:04 View Log
 Security (N/A) 3 Second(s) 495 Millisecond(s) 19.02.2017 11:09:08 View Log
 Registry (N/A) 18 Second(s) 814 Millisecond(s) 19.02.2017 11:10:00 View Log
Analysis of Group Policy Events in Windows System Logs
In the application log, the EventID 6006 from Winlogon with the following message can evidence of the slow policy application:
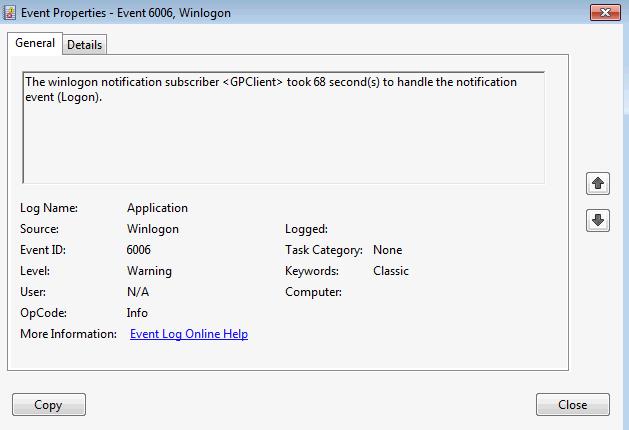
According to this event, a user had to wait till group policies were applied during the boot for almost an hour…
In Windows 7 / Windows 2008 R2 or higher, all the events related to group policy processing on a client are available in Event Viewer (eventvwr.msc) in Applications and Services Logs –> Microsoft -> Windows -> Applications and Services Logs -> Group Policy -> Operational.
To analyze the policy application time, the following EventIDs will be useful:
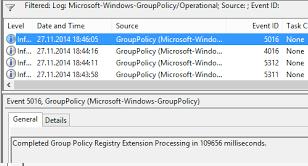
- The events with the IDs 4016 and 5016 show the time when the processing of GPO application extensions starts and ends. The latter also indicates the total time of the extension processing. For example, on the screenshot below the filtering of Group Policy -> Operational by the EventID 4016 and 5016 was enabled. In the message of EventID 5016 you can see the time of this GPO component processingCompleted Group Policy Registry Extension Processing in 109656 milliseconds.

- EventID 5312 contains the list of the applied policies, and the EventID 5317 shows the list of the filtered GPOs.
- EventID 8000 and 8001 contain the time of computer and user policy processing during the boot, respectively. And EventID 8006 and 8007 have the data about the time of policy application during regular updates.
When analyzing the log, pay attention to the time between two neighboring events. It can help to find the problem component.
GPSVC Debug Log
In some cases it is useful to enable GPO processing debug log — gpsvc.log. Using timestamps in gpsvc.log you can find GPO components that have been processed for a long time.
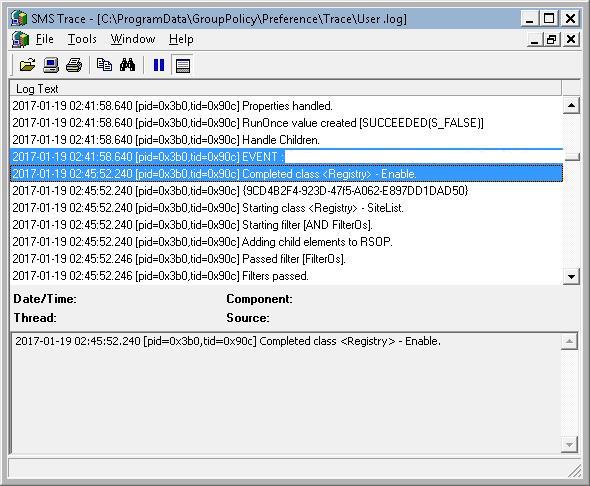
Group Policy Preferences Debug Logs
Group Policy Preferences extensions can also log the booting of each CSE (Client-Side Extensions) component. CSE debug logs can be enabled in the following GPO section: Computer Configuration -> Policies -> Administrative Templates->System->Group Policy -> Logging and tracing
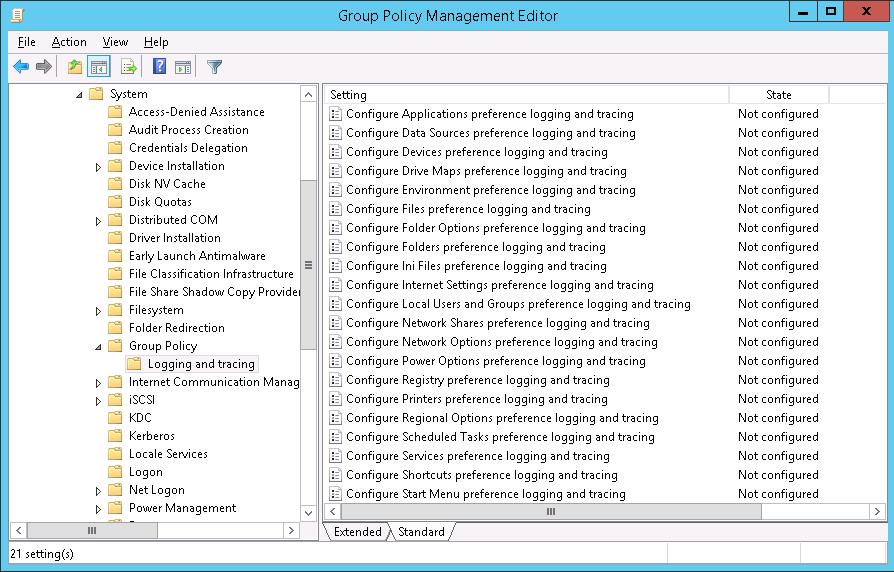
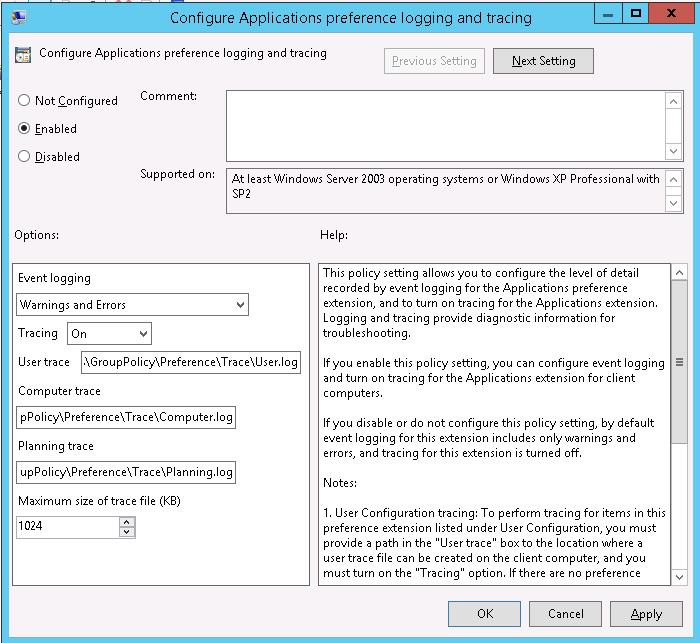
As you can see, the individual settings are available for each CSE. In the policy settings, you can specify the logged event type (Informational, Errors, Warnings or all of them), maximum log size and log location path:
- User policy trace file %SYSTEMDRIVE%\ProgramData\GroupPolicy\Preference\Trace\User.log
- Computer policy trace file %SYSTEMDRIVE%\ProgramData\GroupPolicy\Preference\Trace\Computer.log
After collecting the logs, you need to analyze them for errors, and also try to find nearby events, the time between which is different for a few minutes.
So in this article, we have considered the main ways to diagnose the slow Group Policy processing on the domain computers. I hope the article will be useful.
4 comments
[…] On peut également utiliser les propositions ici : https://woshub.com/troubleshoot-slow-gpo-processing-and-login-speed-impact/ […]
Great One!! many thanks
so good , thancks
Great post, this helped me so much, to pin down which printer policy was causing a 10 minute boot time delay.